
|
The following text was presented as a
Poster at the AFO 2000 Status Meeting (Oktober 2002) and
summarises the result of the ongoing activities of the SATEC4D
group at EURAD.
|
Objectives
|
|
|
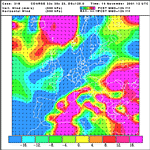
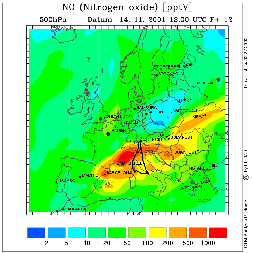
Figure 1: CONTRACE (14.11.2001 - Flight 1); left panel:
wind fields at 12 UTC as a 36 hour forecast showing strong up-winds
in the east Mediterranean region; right panel: forecasted NO
concentrations at 500hPa (including the flight track), interpreted
as a feature of a warm conveyor belt.
|
A skillful combination of models with data from measurement
campaigns is feasible only with spatio-temporal data assimilation. The
objective of the project is to analyse mesoscale measurement
campaigns. With the 4 dimensional variational data assimilation
(4D-var) algorithm as an advanced inversion technique the option is
given to obtain a consistent combination of both model and
observations, or, alternatively, strong indications of incompliances.
The underlying model is the mesoscale EURAD chemistry transport
model. In addition to assimilation runs, the project work includes
development issues: variational data assimilation with grid nesting,
which is in progress and, likewise, the extension of the assimilation
system to non-hydrostatic simulations.
SATEC4D is scheduled to collaborate with four measurement campaigns
within the AFO2000 funding program, approximately one per year,
preceded by an initial assimilation analysis of the BERLIOZ
experiment. SATEC4D meanwhile provided forecast simulations for these
four AFO2000 campaigns and assimilated the BERLIOZ campaign.
Model description and assimilation technique
|
|
|
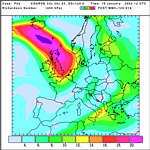
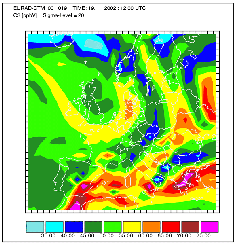
Figure 2: SPURT (19.01.2002); Richardson number (left hand
side) at 400hPa and the ozone concentrations at sigma level 20
(~400hPa) (right hand side).
|
The EURAD CTM2 is a comprehensive tropospheric Eulerian model
operating on the mesoscale-alpha. The chemistry transport model
calculates the transport, diffusion, and gas phase transformation of
about 60 chemical species with 158 reactions. The present grid
configuration is 100 hPa model top with 77 x 67 x 15 or 33 x 27 x 15
grid points with 54 km grid resolution. The associated adjoint
operators include the gas phase mechanism, the transport schemes and
an implicit vertical diffusion scheme. As the specification of error
covariances is crucial in data assimilation techniques, special
efforts were devoted to identify proper weights in the case of joint
emission rate and initial value optimisation. The evolving forecast
skill is taken as criterion for identification of the pertinent
weights. Given the limited set of observations compared to the much
|

|
|
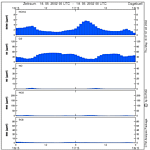
Figure 3: AFOHAL (16.05.2002); left panel: chemogram at
location Dagebüll; right panel: NO2 mixing ratio as a surface plot
for the Nest1-area.
|
larger number of model concentrations, the inversion is an ill-posed
problem in a mathematical sense. In these cases the solution is
constrained to the least deviation from given background information
(= first guess estimates) of emission rates and initial state
values. Data assimilation algorithms, which comply with requirements
mentioned above must provide a "Best Linear Unbiased Estimate'' (BLUE)
in the space-time domain. The four dimensional variational data
assimilation (4D-var) method provides for a consistent state analysis
in the BLUE sense, while smoothing of observational noise.
Campaign support
To foster a closer collaboration by direct campaign support, it was
decided to provide forecast simulations for the measurement episodes
in addition to the project commitments, as service to the data
providers. The supported AFO2000 campaigns are CONTRACE
(02.-30.11.2001), VERTIKO (17.05.-10.7.2002), SPURT (17.-19.01.2002)
and AFOHAL (17.04.-24.05.2002). In extension to the scheduled work
package, for all these campaigns chemical and meteorological forecast
simulations were provided as campaign support and made available on
the institute's web server (examples are given in
Fig. 1-4).
|
|
|
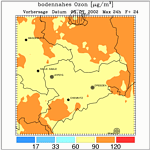
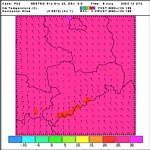
Figure 4: VERTIKO (08.07.2002); daily maximum in the ozone
concentration for the additional saxonian nest (left panel) and
the temperature field overlying the horizontal wind field at 12
UTC (right panel).
|
Graphical output of all campaign simulations is held
available on a SATEC4D archive. The various objectives of these
campaigns may be found in the respective abstracts/posters.
CONTRACE flight schedule planning was actively supported by 48 hours
real time chemical forecast with concentration fields of a variety of
constituents (Fig. 1).
Chemograms for the location Dagebüll were provided in support of the
AFOHAL experiment (Fig. 3). The VERTIKO campaign forecast was
furnished with a second nest level by 5 km x 5 km horizontal
resolution over Saxony and the provision of a emission inventory of
corresponding resolution.
Assimilation of the BERLIOZ campaign
The BERLIOZ campaign is re-simulated as the project's first
assimilation study and observations of SO2, O3, NO, NO2, and CO are
assimilated with the 4D variational algorithm. In addition to campaign
data also routine observations from various central European
observation networks are assimilated. Assimilation experiments with
separate and combined optimisation of initial values and emission
rates are performed.

|
|
Figure 6: All available observations for grid box (27,16,1)
compared with first guess and analysis run; see text for further
information.
|
The potential and limits of data assimilation with too a coarse model
grid of 54 km is demonstrated in Fig. 6 for a densely observed Berlin
grid box. Clearly, the variation exceeds the assumed observational
accuracy, and making it possible to estimate the error of
representativity for this grid box and each multiply observed
constituent. In general, the error appears to have a non-Gaussian
density distribution. With a significant number of NO measurement
sites having concentration levels exceeding 100 ppbv, it can be
concluded that many of them are too close to roads to have some
reasonable information for the assimilation procedure. An analog
picture is exhibited for NO2, and, with a qualitatively inverse
display visible for ozone. SO2 concentration levels are only modestly
scattered, with only one outlier. A critical case is illustrated by
CO, where concentration levels given in multiples of 43 ppbv only are
available.
Outlook
The assimilation for the supported campaigns will be continued
according to the project description approximately one per year, with
presently assimilation of CONTRACE I measurements being in progress.
Authors: A. Strunk, H. Elbern


