The following text was presented as a Poster at the AFO 2000 Status Meeting (Oktober 2002) and summarises the result of the ongoing activities of the SACADA group at RIU.

|
The following text was presented as a Poster at the AFO 2000 Status Meeting (Oktober 2002) and summarises the result of the ongoing activities of the SACADA group at RIU. |
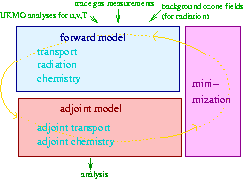
Key objective of the Rhenish Institute for Environmental Research (RIU) is the development of the algorithm of the chemical 4-dimensional variational (4D-var) data assimilation system. This comprises
The adjoint of the Hendricks et al., (2001) chemistry module has been developed, using now a second order Rosenbrock solver. In total 41 species are included, interacting in 147 gas phase and 7 heterogeneous reactions. The work progress presented here is divided into 2 steps:
1. Chemistry box model test results: The focus here
was placed on observability tests to investigate how well a chemical
state can be identified given a predefined observation configuration.
Two artificial sets of "measurements" have been applied, which comprise
the species scheduled to be routinely retrieved from ENVISAT
sensors by ESA, and a more extensive data set to be provided by the project
partners IMK and IFE. Alternatively it is asked which observation
configuration is necessary to identify the chemical state and its
evolution as unambiguously as possible.
2. CRISTA campaign assimilation results:
The chemistry mechanism and its adjoint have been added to the
COMMA transport model, which thus set up the 4D-var assimilation
system. CRISTA retrievals from the campaign Nov. 4 - Nov. 11, 1994 were
assimilated.
To verify the numerical correctness and robustness of the program code, a comprehensive set of so called observability tests was conducted. Moreover, these tests were used to explore the potential and limits of 4D-var data assimilation applied to the particular problem of assimilating artificial ENVISAT MIPAS and SCIAMACHY observations. The procedure is illustrated in Figure 1:
 |
| Figure 1: Observability Test: An artificial set of "measurements" is generated by means of a model run (called the reference run). The assimilation procedure is then started with initial values deviating from the reference run (called first guess). Successful assimilation - that is a model run started with optimised initial conditions (analysis run) - manages to recover the reference run for all species that sufficiently interact via chemical reactions with "observed" species. |
Two data sets were included in the investigation:
| GAS | HET | |
| Day of Year | 41 | 250 |
| Longitude | 0° | 0° |
| Latitude | 45° N | 75° S |
| Pressure [hPa] | 10.9 | 37 |
| Temperature [K] | 228 | 191 |
| Perturbation k | 2 | 0.01 |
| Surface areas [cm²/cm³] | ||
| PSC Ia | 0 | 1.3E-7 |
| PSC II | 0 | 1.3E-7 |
| Sulfate Aerosol | 0 | 8.0E-9 |
Results in the case HET (Figure 3) are generally as good as for chemistry with zero ice, NAT and sulfate aerosol surfaces (Figure 2). In both cases the analysis error for most species (even for most of unobserved species) is well below 10 % of the initial (first guess) error at the end of the assimilation window.
Assimilation performance is fully satisfying with standard data set, while with extended data set the algorithm manages to recover the reference run almost perfectly in the majority of cases.
But even with standard data set extended only by one chlorine-species (e.g. HOCl as in Figure 3) results are close to those of extended data set with a total number of only 8 measurements in 24 hours.
 |
 |
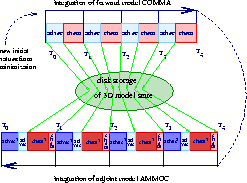
| Figure 4 (Click to get higher resolution images): Setup of the AMMOC-CTM (left) and storage strategy for one iteration (right). | |
Three-dimensional transport experiments have been carried out. Due to limitations in computing time, the experiments including chemistry have been limited to 2 spatial dimensions. The results presented here have been obtained through the following experiment: the COMMA-CTM was initialized for Nov. 4, 1994, 12 UTC with CRISTA-data averaged zonally and over the time span of the whole campaign. Retrievals of O3, HNO3, CH4, N2O, ClONO2, and CFC11 were assimilated into the model using an assimilation window of 24 hours. The analysis result at the end of the assimilation interval of 24 hours was used as first guess for the subsequent assimilation period. Figure 5 shows the analysis result for N2O at 10.9 hPa on Nov. 8, 0 UTC which can be compared with the measurements during the assimilation period, interpolated on a 2° by 2° grid. A close correspondence is visible due to the small diurnal variation of N2O. The superiority of the 4D-var assimilation system over the simple interpolation can be seen in Figure 6 which shows the assimilation result for ClONO2 and the interpolated measurements. Most of the measurements are taken during the night or at dawn where ClONO2 concentrations are higher than during the day. The model result shows the diurnal cycle.
The temporal development of the concentration at one grid point shows the ability of the model system to assimilate the measurements (Figure 7). These results show that the assimilation procedure gains a considerable improvement over legacy model runs, as the discrepancies between the observations and the model are significantly reduced, while chemical consistency is maintained by the computationally costly, but skillful 4D-var technique. By transport into the polar cap, a gradual improvement of chemical state analysis even in permanently unobserved regions is attained.
The complete 4D-var system requires 200 CPU hours for the analysis of a 24 hour period, assuming that 20 iterations have to be performed, on a 900 MHz Ultra Sparc III processor. The storage demands are also very high. 10 GB have to be stored for subsequent re-use. This includes 4D concentration fields, the photolysis rates, wind and temperature fields. To allow for detailed analysis, the measurement and the adjoint of the concentration fields have to be stored additionally which in total requires at least 21 GB storage space per analyzed day.
Based on the operational ESA ENVISAT MIPAS and SCIAMACHY standard data sets, it is demonstrated that analysis of the chemical state even for most unobserved species can be expected by means of 4-dimensional variational data assimilation. It is further shown that this procedure is suitable to produce a chemically consistent map of stratospheric constituents from the CRISTA-sensor measurement set that is scattered both in space and time. The integration of more elaborated error-covariance statistics in the case of ENVISAT data (DFD, DLR) will further improve the assimilation results. However, the computational demands are very high. Considerable advancement can be expected here by the introduction of the numerically more efficient parallel icosahedral grid (SCAI, FhG).
Authors: H. Elbern, D. Klasen, A. Klioutchnikova, J. Schwinger